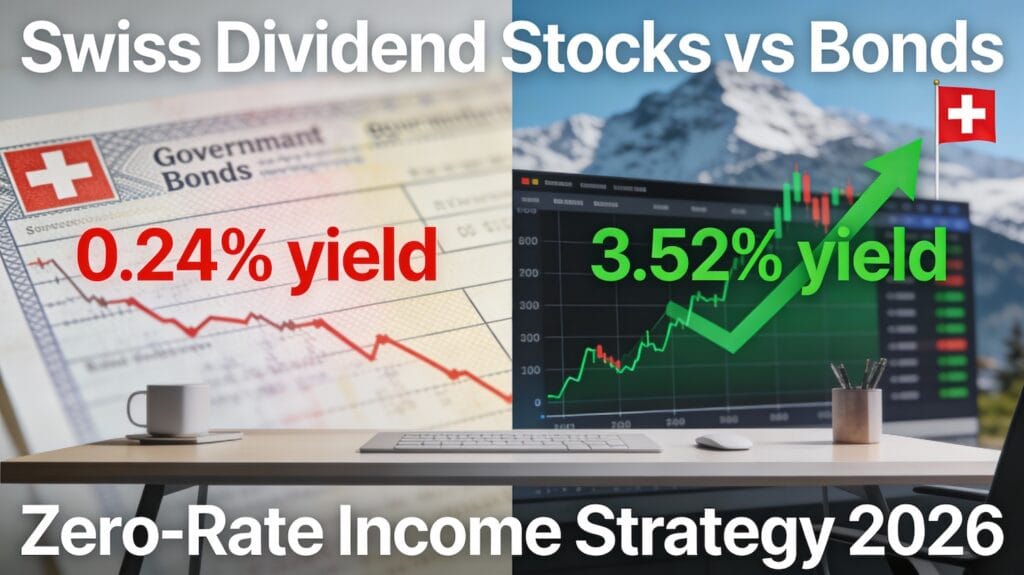
The top Swiss stocks 2016-2026 tell a story that most financial media never bothered to write: one stock compounded at 16.4% annually for a decade, another crawled at 2.58%, and both wore the label “Swiss blue-chip” the entire time. If you treated them interchangeably, you lost roughly 14 percentage points per year to a neighbour who didn’t.
This analysis covers all ten SMI heavyweights that shaped Swiss equity returns across that decade. The data is drawn from published annual reports, Swiss Exchange filings, and SNB statistical releases. The goal is simple — to show which business models genuinely compounded capital, which ones quietly destroyed it, and where the asymmetric opportunities sit heading into 2026–2030.
Before getting into individual stocks, a quick note on why Switzerland matters as an investment universe in the first place.
Why Switzerland’s Fiscal Framework Matters for Equity Investors
Most investors skip past the macro and dive straight into P/E ratios. That’s a mistake when analysing Swiss equities, because the macro is the moat.
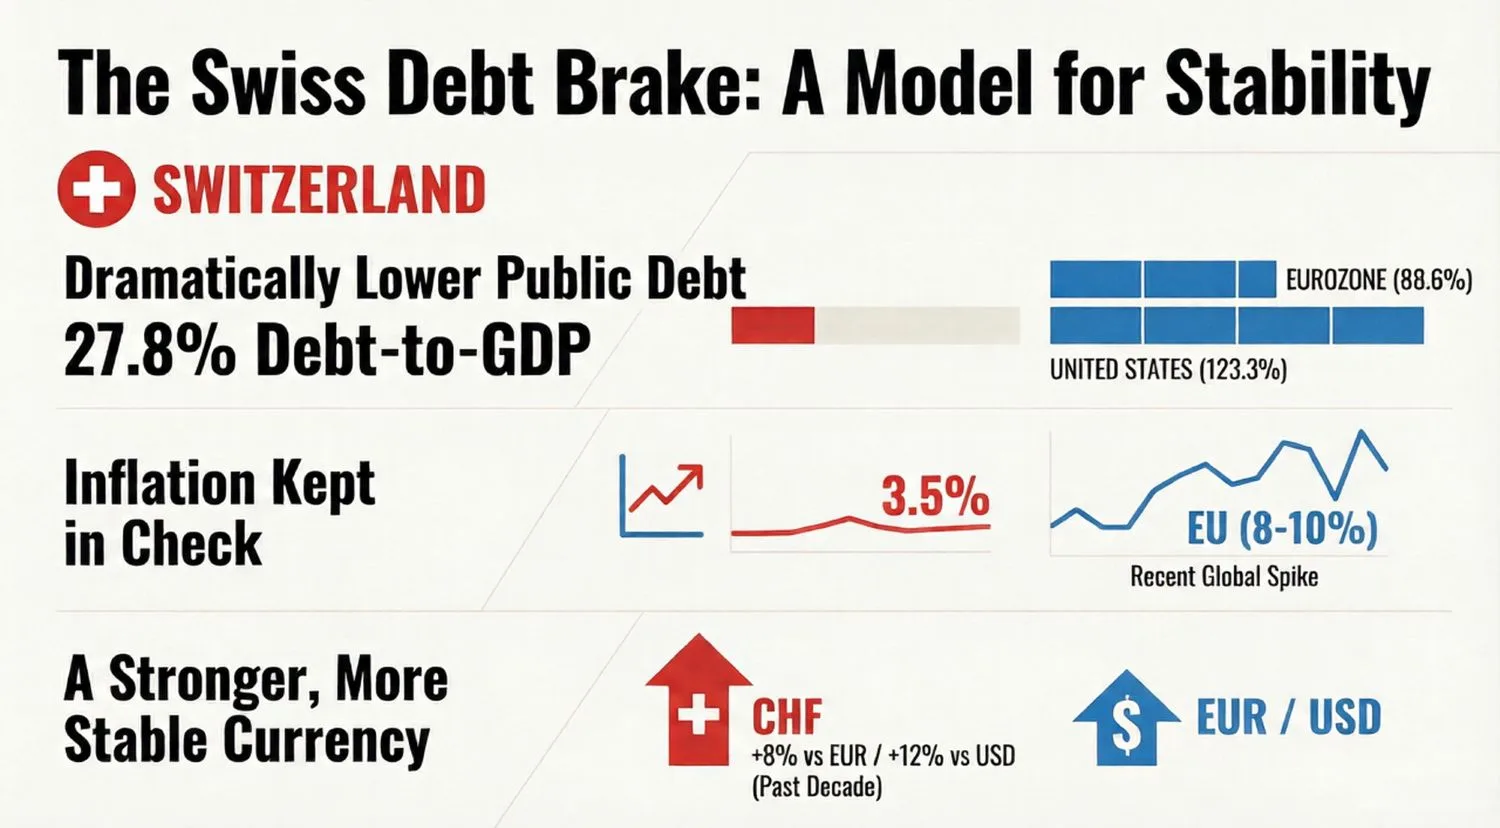
Switzerland’s Debt Brake — written into the federal constitution in 2003 — caps spending at revenues averaged across economic cycles. Surpluses go into a reserve; downturns draw from that reserve rather than bond markets. The result after twenty years: a debt-to-GDP ratio of 27.8%, compared to 88.6% for the Eurozone and 123.3% for the United States.
Here’s the thing — that fiscal discipline feeds directly into corporate behaviour. When the sovereign doesn’t need to crowd out capital markets, Swiss companies borrow cheaply. When inflation stays anchored (Swiss CPI peaked at 3.5% in 2022, versus 10%+ across the EU), management teams can plan in decades rather than quarters. And when the franc appreciates 8.3% against the euro and 12.1% against the dollar over a decade, every CHF-denominated dividend becomes worth more in the investor’s home currency.
For foreign investors, this creates what practitioners sometimes call a “currency fortress effect.” A 7.79% Swiss franc return delivered 9–10% in euro terms and 10–12% in dollar terms over the full decade. That tailwind is structural, not lucky. You can open a Swiss bank account to hold CHF-denominated assets directly and capture this advantage.
Complete 10-Year Performance Matrix: Top Swiss Stocks 2016–2026
Three companies — Swiss Life, Partners Group, and ABB — delivered returns meaningfully above the 7.79% annual benchmark. The rest underperformed it. Here’s the full picture:
| Stock | Ticker | 10-yr CAGR | Total Return | Current P/E | Dividend Yield | 10-yr Div Growth |
|---|---|---|---|---|---|---|
| Swiss Life | SLHN | 16.4% | 311.8% | 19.9× | 4.23% | 15.1% |
| Partners Group | PGHN | 15.3% | 248.7% | 23.0× | 4.0% | New policy |
| ABB | ABBN | 12.2% | 199.9% | 32.2× | 1.22% | 2.2% |
| ── SMI Benchmark: 7.79% CAGR / 117.8% total return ── | ||||||
| Geberit | GEBN | 5.9% | 76.5% | 33.9× | 2.04% | 4.4% |
| Holcim | HOLN | 5.8% | 76.0% | N/A | 3.9% | −2.2% |
| Schindler | SCHN | 5.8% | ~75% | N/A | 2.1% | 0.0% |
| Zurich Insurance | ZURN | 5.1% | 64.7% | 24.8× | 4.4% | 5.1% |
| Novartis | NOVN | 3.96% | ~47% | 16.9× | 3.77% | 2.7% |
| Roche | ROG | 2.94% | ~34% | 27.7× | 2.8% | 1.2% |
| Nestlé | NESN | 2.58% | 28.8% | 20.3× | 4.2% | 0.6% |
The gap between Swiss Life (16.4%) and Nestlé (2.58%) sounds like an outlier. Over ten years, compounded, it’s the difference between a 311% return and a 29% one. That’s not noise — it’s a business model difference.
Visualising the Performance Gap: CAGR Across All 10 Stocks
Bar chart showing the 10-year compound annual growth rates for ten Swiss blue-chip stocks from 2016 to 2026. Swiss Life leads at 16.4%, followed by Partners Group at 15.3% and ABB at 12.2%. The SMI benchmark sits at 7.79%. Below the benchmark: Geberit 5.9%, Holcim 5.8%, Schindler 5.8%, Zurich Insurance 5.1%, Novartis 3.96%, Roche 2.94%, Nestlé 2.58%.
Swiss Life: The Quiet Wealth Compounder That Beat Everything
CHF 8.50 in 2016. CHF 35.00 in 2026. That’s a 311.8% total return — or, in plain language, every CHF 10,000 invested became CHF 41,180. No crypto volatility required.
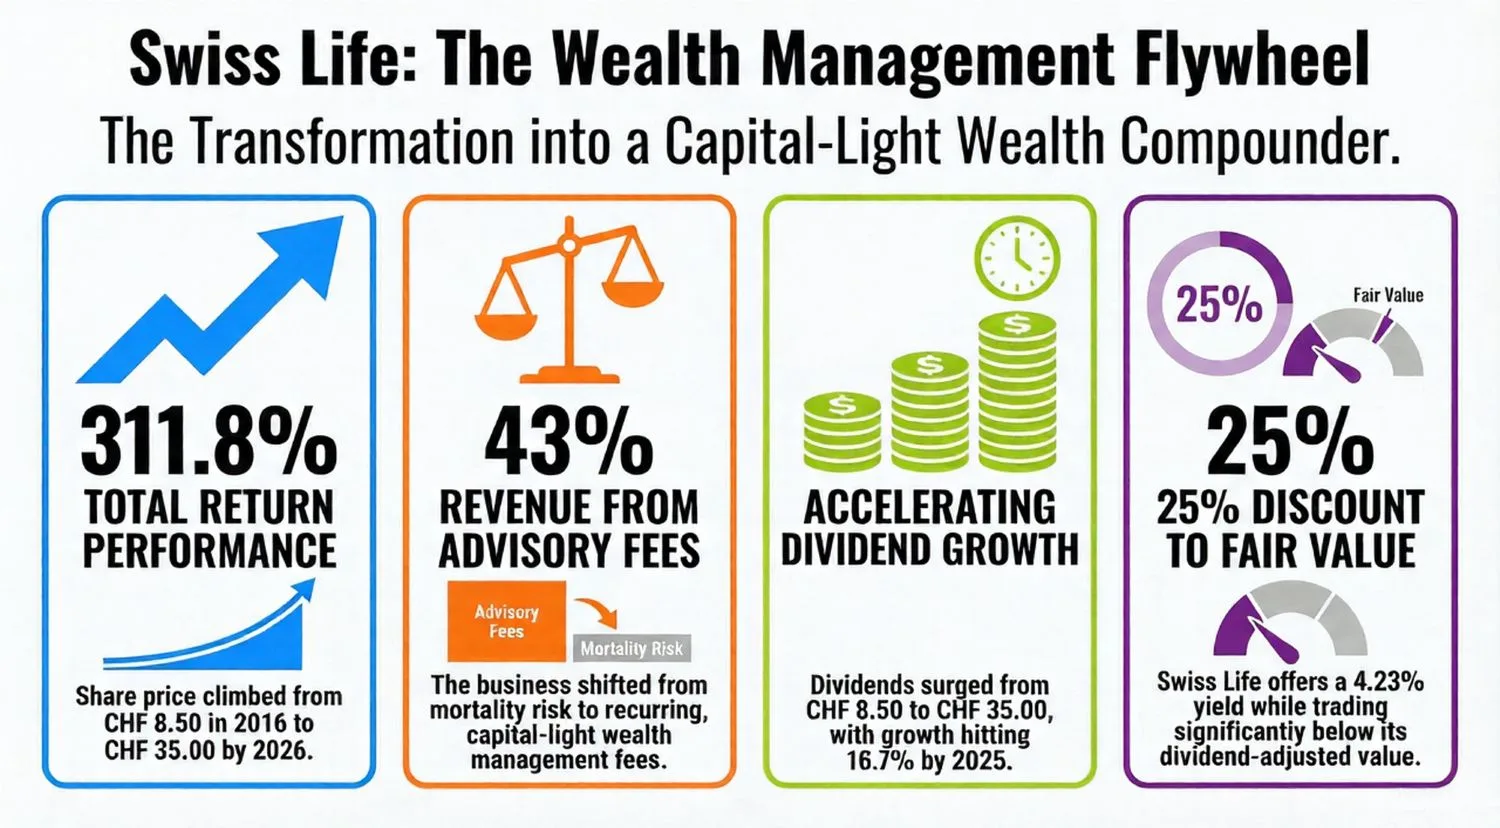
The engine behind it was a deliberate transformation. Swiss Life shifted from traditional life insurance — mortality risk, capital-heavy, margin-compressed — into fee-based wealth management serving ultra-high-net-worth clients across Switzerland, France, and Germany. By 2025, 43% of revenues came from asset management and advisory fees. Those revenue streams are recurring, capital-light, and growing at 9–12% annually.
The dividend trajectory tells the whole story more cleanly than any earnings press release:
Notice the acceleration from 2020–2025 — the period when the wealth management flywheel hit its stride. Dividend growth ran at 10.9% annually during that window, compared to 3.0% in the 2016–2020 phase.
At 19.9× price-to-earnings with 15.1% dividend growth visibility through 2027, Swiss Life still trades at what looks like a meaningful discount to its dividend-adjusted fair value. The 4.23% current yield provides income while you wait for compounding to continue. For investors exploring Swiss equities through Swiss dividend strategies, this remains the benchmark to measure everything else against.
Partners Group: Spectacular Gains, a 46% Crash, and What Comes Next
CHF 290 in 2016. CHF 1,065 in 2026. The journey between those two numbers included a 316% surge through 2021, a 46% peak-to-trough collapse in 2022, and a choppy recovery since.
Partners Group rode the zero-rate era better than almost anyone. Institutional capital flooded into private equity, infrastructure, and real estate when bonds yielded nothing. Then 2022 arrived: rates spiked, private asset valuations reset, and the stock gave back nearly half its value in months. Subsequent annual performance — +48.5%, +1.4%, then another decline — reflects ongoing uncertainty about whether valuations in private markets have fully normalised.
The current 22.3% year-to-date decline might represent an entry point for investors with 3–5 year horizons who believe rate cuts will revive private asset appetites. But understand what you’re buying. This is cyclical alternative asset exposure, not a steady compounder. Drawdowns of 20–30% are part of the deal. Suitable for sophisticated investors; dangerous for anyone expecting Swiss Life-style smoothness.
ABB: Industrial Automation’s Decade-Long Winner
ABB’s 199.9% total return over ten years came from two structural tailwinds that never ran out of fuel: factories automating to replace manual labour, and electrical grids upgrading for EVs and renewable energy. Both trends are multi-decade in nature. Neither depends on GDP growth to continue — manufacturers automate harder during downturns to cut costs, not just during booms to add capacity.
The 2020–2025 acceleration reflects three concrete catalysts. Post-COVID supply chain anxiety drove manufacturing onshoring across the US and Europe, requiring new factory investment. AI compute demands are triggering massive electrical infrastructure buildouts — ABB’s core competency. And EV charging infrastructure became national priority spending in every developed economy simultaneously.
At 32.2× earnings, the multiple is rich. Expected earnings growth of 8.4% doesn’t fully justify it on paper. However, the secular themes remain intact, and secular themes tend to justify premium multiples for longer than value investors expect. A 10–15% pullback toward 28× earnings would create a more attractive entry. For now, it remains a hold for existing positions and a watchlist item for new ones.
If You Had Invested CHF 10,000 in Each Stock in 2016
Line chart showing CHF 10,000 growing over ten years in Swiss Life (to CHF 41,180), Partners Group (CHF 34,870), ABB (CHF 29,990), SMI benchmark (CHF 21,780), Zurich Insurance (CHF 16,470), and Nestlé (CHF 12,880).
The Dividend Aristocrats: Zurich Insurance and Geberit
Zurich Insurance — Predictable Income, Properly Priced
Zurich delivered 64.7% total return over ten years. That’s below the SMI benchmark. However, framing it purely as underperformance misses the point of owning it.
Dividend progression from CHF 17.00 in 2016 to CHF 30.24 in 2025 — at a payout ratio consistently between 75–85% — represents steady, sustainable income compounding. The company maintains a solvency ratio of 215% against a 150% minimum requirement. It navigated multiple insurance catastrophe cycles without cutting its payout once. Solvency plus consistency is the product. That’s what a 4.4% current yield plus 5% annual growth delivers: roughly 9–10% total returns with bond-like volatility.
Think of Zurich as a sovereign-linked bond yielding 5% with built-in inflation protection. Not exciting. Not meant to be.
Geberit — 23% ROIC and the Premium It Deserves
Geberit’s 76.5% total return looks unimpressive until you look inside the business. A 23% return on invested capital — sustained over five years — in a mature industrial sector is exceptional. Few companies worldwide achieve this; fewer maintain it across economic cycles.
The business model is more resilient than it appears. Renovation activity drives the majority of revenue, not new construction. Renovations happen in recessions too — bathrooms break regardless of GDP. That’s why Geberit kept growing dividends through 2020 when construction starts collapsed globally.
At 33.9× earnings the valuation looks expensive in isolation. In the context of 23% ROIC and renovation-cycle resilience, it reflects quality that the market has consistently been willing to pay for. This is a quality compounder, not a value play.
Roche and Novartis: Why the Recovery Story Deserves a Closer Look
Both companies underperformed the SMI over ten years — Roche at 2.94% annually, Novartis at 3.96%. And yet both delivered 25%+ returns during 2024–2025. The divergence between the decade-long lag and the recent recovery reveals the nature of pharmaceutical investing: long stretches of patent-driven pressure punctuated by pipeline-driven surges.
Roche
Current price CHF 348.90. P/E of 27.7× expected to compress toward 15.64× by 2026 — but only if earnings recover by roughly 77%. That’s a large assumption. It requires no major patent expirations, stable diagnostics revenue (which normalised sharply post-COVID), and meaningful pipeline success. Analyst consensus targets CHF 326.4, implying slight downside from current levels. Roche’s dual business model — oncology pharmaceuticals plus diagnostics — provides diversification most pharma companies lack. The IMD ranked it second globally for pharmaceutical R&D readiness in 2025. For patient investors, valuations below 25× earnings (around CHF 310–320) would create a more attractive entry.
Novartis
More attractive on valuation: 16.9× earnings against a sector median of 18–20×, with a 3.77% dividend yield and 28 consecutive years of dividend increases. The 2022 Alcon spin-off created a focused pure-play pharmaceutical company. Fiscal 2024 showed double-digit net sales and profit growth — the first full year demonstrating the strategic clarity that transformation provided. Expected 5.5% organic growth with improving margins supports 6–8% total returns. For investors interested in pharmaceutical recovery through Swiss accounts, the bail-in protection framework used by Swiss private banks makes holding both names in a multi-asset structure straightforward.
Holcim and Nestlé: A Value Trap and a Cyclical Opportunity
Holcim — Cyclical Trough, Not a Business Problem
A 12.6% year-to-date decline in 2025 looks alarming on a chart. Then you read the 2024 annual report: record 19.1% EBIT margin, CHF 3.8 billion free cash flow, 11.2% return on invested capital. The market sold the stock on volume fears while the company delivered its best margins ever.
That’s the classic cyclical value setup. Holcim doesn’t need a construction recovery to perform well — it needs construction activity to simply stabilise. At that point, 3.9% dividend yield plus 4–6% earnings growth from margin expansion plus a valuation re-rating from cyclical discount toward historical norms (8–9× EV/EBITDA versus 10–12× historical average) creates 8–15% annual return potential. The analyst consensus target of CHF 79.21 implies 20–30% upside from current levels.
Nestlé — The Value Trap Disguised as a Safe Haven
This one hurts to write, because Nestlé has been a default “defensive hold” for European wealth managers for thirty years. The data from the past decade is unambiguous: 2.58% annual return, 0.6% annual dividend growth, 5+ percentage points of annual underperformance versus the SMI index.
A 4.2% yield looks attractive until you realise dividend growth of 0.6% means your real purchasing power shrinks 2–3% annually once inflation is factored in. The 2024 CEO change initiated a turnaround narrative, and current 20.3× earnings represents a 10–15% discount to historical norms. However, turnaround execution in consumer staples is slow and uncertain. The structural headwinds — health-food trends, emerging market deceleration, pricing power erosion — haven’t reversed yet.
Better income opportunities exist within this same list. Zurich Insurance offers 4.4% yield with 5% growth. Swiss Life offers 4.23% yield with 15% growth. Both protect purchasing power. Nestlé currently doesn’t.
Building a Swiss Equity Portfolio for 2026–2030: The Barbell Approach
Ten years of data produces a clear lesson: overweighting pharma and consumer staples because they “feel safe” delivered a decade of underperformance. The winning approach — evident in hindsight, executable going forward — combines defensive income compounders with selective growth and cyclical value exposure.
The core (60% in Swiss Life and Zurich Insurance) generates a blended dividend yield of 4.3% growing at 10% annually. The tactical satellites (ABB, Geberit, Holcim) add 40% exposure to automation, quality manufacturing, and cyclical value respectively. Expected portfolio characteristics: 3.8–4.2% blended yield, 7–9% dividend growth, 8–12% annual total return, maximum drawdown of 15–20% versus the SMI’s 25–30%.
Investors holding these positions through Swiss private banking accounts benefit from additional structural advantages — currency appreciation on CHF-denominated dividends, access to securities lending, and custody separation that provides asset protection. For those without an existing Swiss relationship, Swiss bank accounts for non-residents have become considerably more accessible over the past five years.
Three Real Lessons From a Decade of Swiss Equity Data
1. Dividend Growth Rate Matters More Than Yield
Swiss Life’s 15.1% annual dividend growth compounding for ten years created more wealth than Nestlé’s 4.2% yield growing at 0.6%. After a decade, Swiss Life’s dividend income alone exceeded Nestlé’s starting yield. The mathematics of dividend growth are brutal — and they compound in your favour when you pick correctly.
2. Brand Recognition Does Not Equal Returns
Roche and Nestlé were “defensive growth” Swiss blue-chips throughout this period. Both delivered sub-3% annual returns. Strong brands don’t protect against business model erosion or poor capital allocation. The market doesn’t care about marketing heritage — it prices future cash flows.
3. Volatility in Quality Companies Is Opportunity, Not Risk
Partners Group fell 46% in 2022. Holcim fell 12.6% in 2025. Both declines represented entry points for patient capital, not reasons to exit. The true risk in this dataset wasn’t volatility — it was buying Nestlé at 25× earnings and watching it compound at 2.58% for a decade while inflation eroded purchasing power. Permanent capital impairment from overpaying for deteriorating businesses is the real danger. Short-term price swings in fundamentally sound companies are not.
This distinction matters particularly for investors managing generational assets — the kind of capital where losing ten years of real returns to a “safe” holding is a catastrophic outcome. For a broader view on protecting capital across market cycles, the gold and alternative asset analysis for 2026 covers the complementary role hard assets play alongside Swiss equities.
Frequently Asked Questions: Top Swiss Stocks 2016–2026
References
- Swiss National Bank — Statistical Publications: exchange rate and monetary data (opens in new tab)
- SIX Swiss Exchange — SMI Index composition and performance data (opens in new tab)
- Swiss Life Holding AG — Investor Relations: Annual Reports 2016–2025 (opens in new tab)
- IMF World Economic Outlook — Sovereign debt-to-GDP data and fiscal sustainability analysis (opens in new tab)
- ABB Ltd — Investor Relations: Annual Reports and electrification strategy documentation (opens in new tab)
Related reading:
- Gold's Reckoning: What the $5,500 Peak, the Devastating Crash, and Recovery Tell Us About 2026 and Beyond
- The Most Dangerous Day to Trade in 2026 — Thursday, March 19
- Your Broker Charges 0.20%. The IRS Charges 0.18%. Guess Which One You Don't See.