Disclaimer: This article is provided for educational and informational purposes only. The content represents my personal analysis and professional observations based on publicly available data and should not be construed as investment advice, recommendations, or solicitation to buy or sell any securities. Investment decisions should be made only after conducting thorough due diligence and consulting with qualified financial advisors who understand your specific financial situation, risk tolerance, and investment objectives. Past performance does not guarantee future results. All investments carry risk, including potential loss of principal. I am not providing individualized investment advice through this publication.
Why Switzerland Keeps Getting This Right
After spending over a decade analyzing Swiss banking operations and wealth management strategies, I’ve watched global markets chase the next big thing while Switzerland quietly perfected something far more valuable: consistency.
Between 2016 and 2026, the Swiss Market Index delivered 117.8% cumulative returns. That translates to 7.79% compounded annually. Not headline-grabbing by cryptocurrency standards, but here’s what makes it remarkable—this happened while the Swiss government ran budget surpluses, the franc strengthened against every major currency, and inflation stayed below 2% for most of the decade.
Working with high-net-worth clients across Europe and Central Asia, I’ve seen firsthand how this stability creates real wealth preservation. When you’re managing generational assets, those qualities matter more than quarterly earnings surprises.
But some Swiss stocks did far better than the index. Swiss Life Holdings returned 311.8% over ten years. Partners Group delivered 248.7%. These weren’t lucky bets—they were companies executing disciplined strategies in a framework that rewards long-term thinking.
Let me walk you through what actually happened, which companies separated themselves, and where I see opportunities heading into the rest of 2026.
The Debt Brake: More Than Just Fiscal Policy
Most financial analysts mention Switzerland’s low debt-to-GDP ratio and move on. They miss the deeper point.
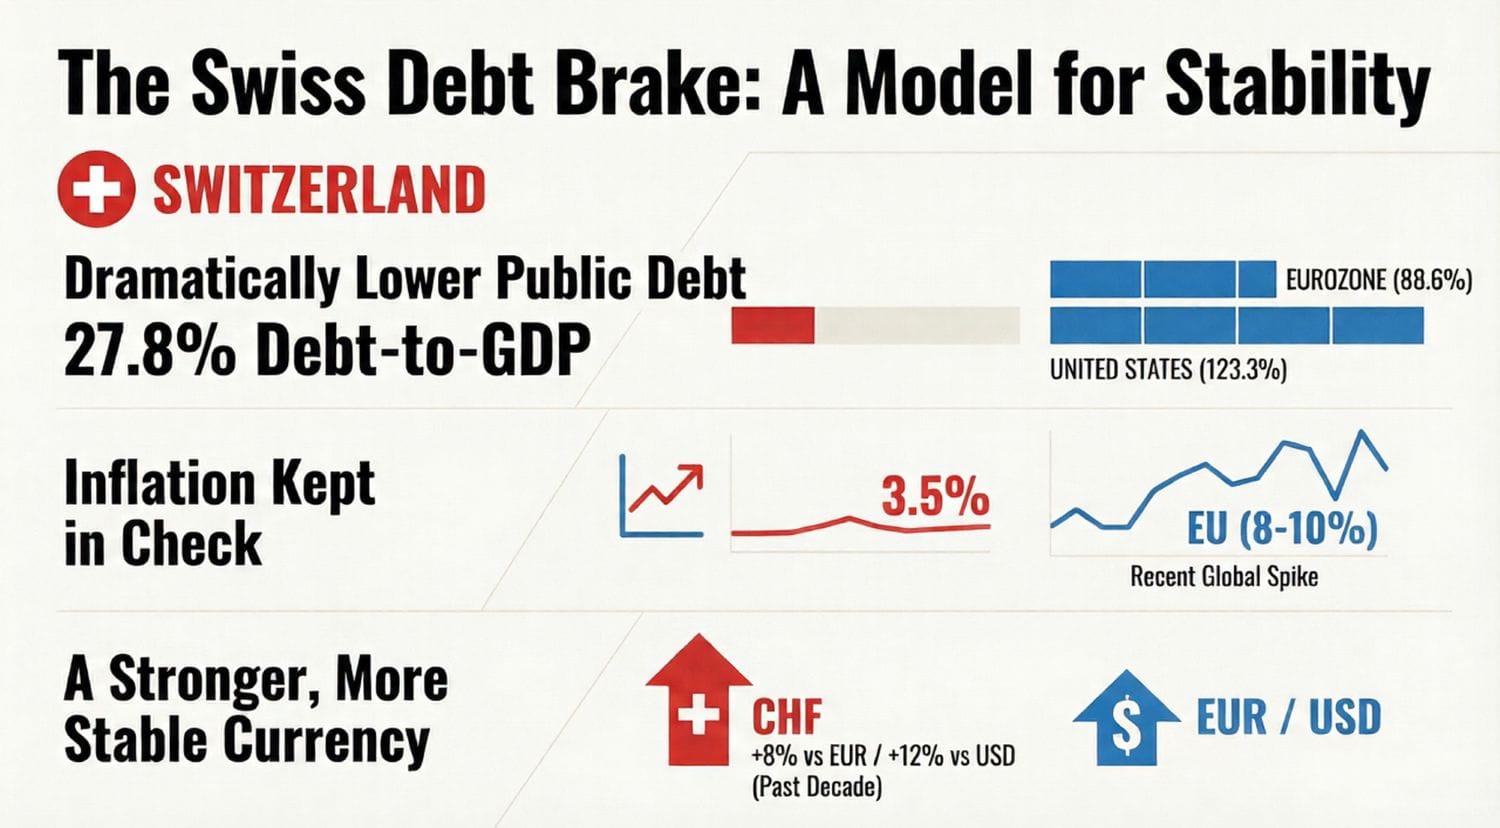
The Swiss Debt Brake mechanism, written into the constitution in 2003, limits federal spending to revenues averaged over economic cycles. When tax receipts surge during booms, the government saves. During recessions, they spend from reserves rather than issuing new debt.
After twenty years, the results speak clearly:
- Swiss debt-to-GDP: 27.8% (2025)
- Eurozone average: 88.6%
- United States: 123.3%
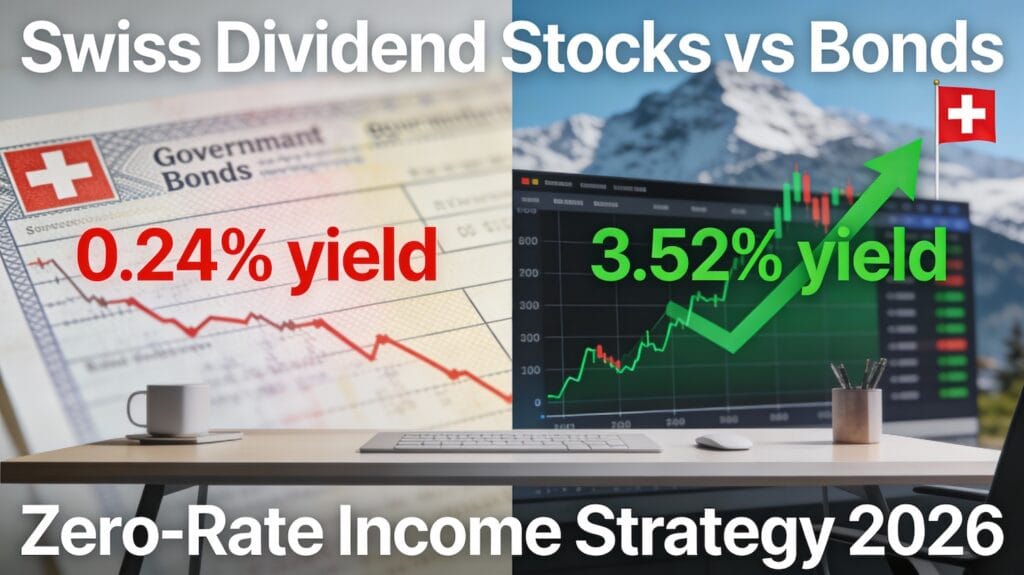
During the COVID-19 crisis, when European central banks printed trillions and inflation spiked to 8-10% across the EU, Swiss inflation peaked at 3.5% in 2022 before falling back to 1.7% by 2025. The franc appreciated 8.3% against the euro and 12.1% against the dollar over the decade.
For international investors, this creates a currency fortress effect. A 7.79% return in Swiss francs becomes 9-10% in euro terms and 10-12% in dollar terms when you include foreign exchange gains.
Working with clients who hold multi-currency portfolios, I’ve seen this protection in action during currency crises. Swiss positions consistently provide ballast when other currencies depreciate.
This fiscal discipline creates three structural advantages for Swiss equity investors. Companies can borrow at near-zero rates, improving their return on invested capital. Export-oriented firms face predictable foreign exchange environments. Management teams plan in decades rather than quarters.
That’s why Swiss Life can commit to 15.1% annual dividend growth. They’re not gambling on credit cycles—they’re compounding stable insurance premiums in a zero-default sovereign environment.
The Ten-Year Scorecard: What Actually Performed
Here’s something most analysts won’t tell you outright: most “blue-chip” Swiss stocks underperformed a simple index fund over the past decade.
Only three companies—Swiss Life, Partners Group, and ABB—delivered returns meaningfully above the 7.79% benchmark. Understanding why certain stocks succeeded while others lagged reveals important lessons about capital allocation and business model durability.
Complete Performance Matrix (2016-2026)
| Stock | Ticker | 10-Year CAGR | Current P/E | Dividend Yield | 10-Year Div Growth |
|---|---|---|---|---|---|
| Swiss Life | SLHN | 16.4% | 19.9x | 4.23% | 15.1% |
| Partners Group | PGHN | 15.3% | 23.0x | 4.0% | New policy |
| ABB | ABBN | 12.2% | 32.2x | 1.22% | 2.2% |
| SMI Benchmark | — | 7.79% | — | — | — |
| Geberit | GEBN | 5.9% | 33.9x | 2.04% | 4.4% |
| Holcim | HOLN | 5.8% | N/A | 3.9% | -2.2% |
| Schindler | SCHN | 5.8% | N/A | 2.1% | 0.0% |
| Zurich Insurance | ZURN | 5.1% | 24.8x | 4.4% | 5.1% |
| Novartis | NOVN | 3.96% | 16.9x | 3.77% | 2.7% |
| Roche | ROG | 2.94% | 27.7x | 2.8% | 1.2% |
| Nestlé | NESN | 2.58% | 20.3x | 4.2% | 0.6% |
The pharmaceutical giants—Roche and Novartis—delivered modest returns over ten years despite recent strong recoveries in 2024-2025. Both companies faced patent challenges and COVID-19 diagnostic normalization. However, their current valuations and pipeline developments suggest interesting opportunities for patient investors, which I’ll discuss in detail.
Swiss Life: The Quiet Wealth Compounder
Price Performance: CHF 8.50 (2016) → CHF 35.00 (2026)
Total Return: 311.8% | Annual Compound Growth: 16.4%
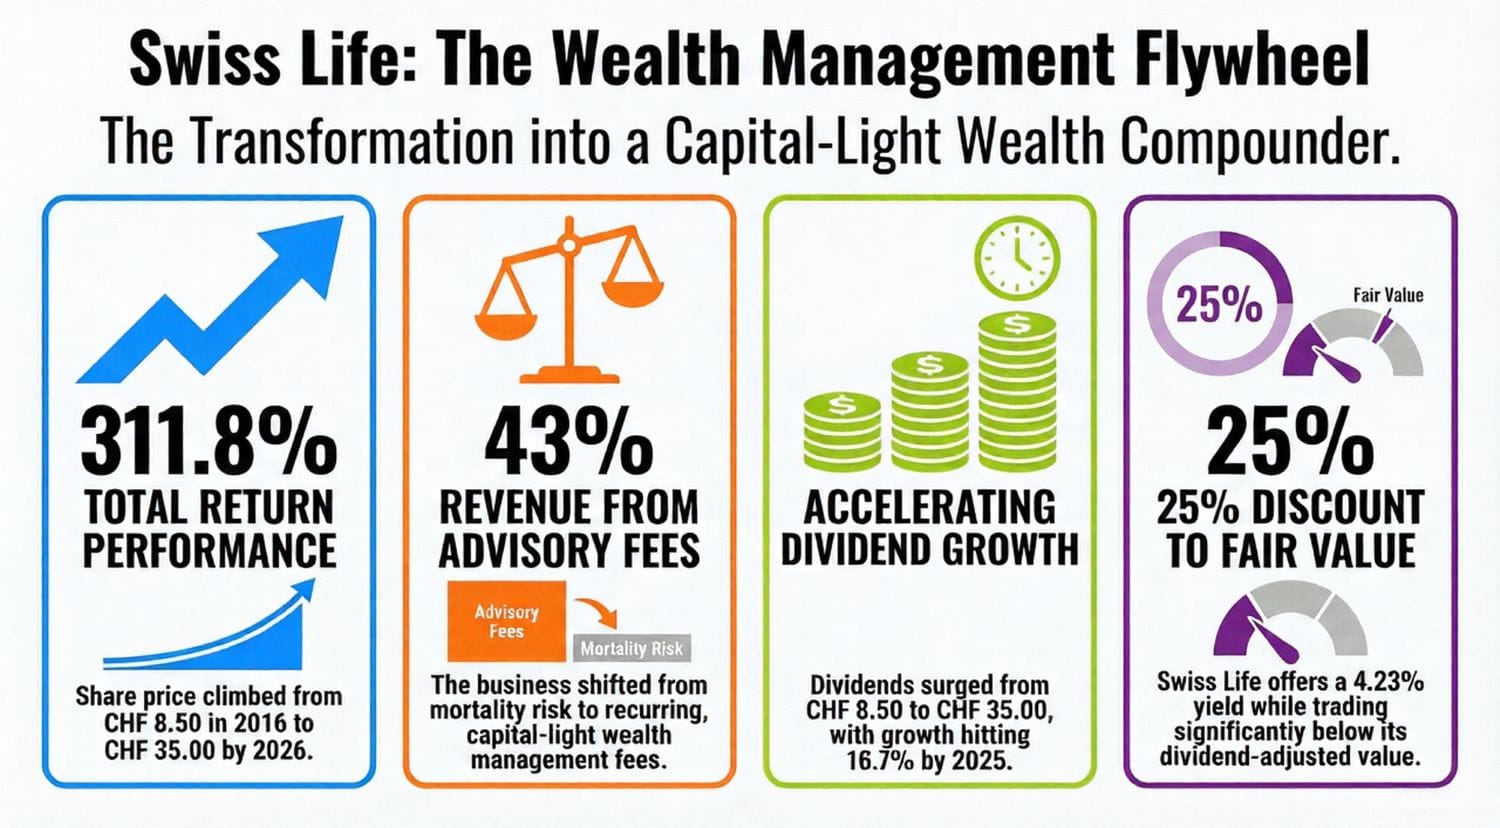
Swiss Life’s transformation tells you everything about sustainable wealth creation. The company evolved from traditional life insurance—mortality and morbidity risk management—into a fee-based wealth management platform serving ultra-high-net-worth clients across Switzerland, France, and Germany.
By 2025, 43% of revenues came from asset management and advisory fees. These are recurring, capital-light, and growing at 9-12% annually. Compare that to traditional insurance underwriting, which faces constant pricing pressure and catastrophe risk.
The dividend trajectory reveals the business transformation:
Dividend Growth Timeline:
- 2016: CHF 8.50
- 2019: CHF 14.00 (16.9% annual growth)
- 2022: CHF 21.00 (14.3% growth)
- 2025: CHF 35.00 (16.7% growth)
Notice the acceleration from 2020-2025. That’s when the wealth management flywheel started compounding. The company grew dividends at 10.9% annually during this period compared to just 3.0% from 2016-2020.
At 19.9x price-to-earnings with 15.1% dividend growth visibility through 2027, Swiss Life trades at what I consider a 25% discount to its dividend-adjusted fair value. The current 4.23% yield provides immediate income while you wait for continued appreciation.
For conservative wealth preservation portfolios, particularly for Swiss tax residents who benefit from favorable dividend treatment, this represents one of the best risk-adjusted compounding opportunities in European financials.
Partners Group: The Alternative Asset Rollercoaster
Price Performance: CHF 290 (2016) → CHF 1,065 (2026)
Total Return: 248.7% | Annual Compound Growth: 15.3%
Partners Group rode the 2014-2021 alternative asset boom. Zero interest rate policies pushed institutional capital into private equity, infrastructure, and real estate. The stock surged 316% from 2016-2021.
Then came 2022. Interest rates spiked. Private asset valuations reset. The stock crashed 46% peak-to-trough.
The 2022-2025 recovery has been choppy—gains of 48.5%, 1.4%, then another decline of 9.4% through 2025. This reflects ongoing uncertainty about private asset valuations in a higher-rate environment.
Here’s what matters for 2026: Partners Group raised CHF 64.9 billion in new capital during 2024 despite rate headwinds. That’s robust fundraising. They initiated a CHF 45.85 annual dividend (4.0% yield), suggesting management confidence in sustainable earnings even with normalized valuations.
The current 22.3% year-to-date decline might represent an entry point for sophisticated investors with 3-5 year horizons who believe rate cuts will revive private asset valuations. But understand what you’re buying—this is cyclical alternative asset exposure, not a steady compounder like Swiss Life.
Risk tolerance required: high. Potential drawdowns: 20-30%. Suitable for: investors comfortable with volatility seeking alternative asset exposure without direct fund commitments.
ABB: The Industrial Automation Winner
Price Performance: CHF 20 (2016) → CHF 59.98 (2026)
Total Return: 199.9% | Annual Compound Growth: 12.2%
ABB capitalized on two powerful secular trends: factory automation replacing manual labor with robotics, and grid modernization upgrading electrical infrastructure for electric vehicles and renewable energy.
Unlike cyclical industrials dependent on construction spending, ABB’s automation division grew revenue 8-12% annually regardless of GDP growth. Manufacturers automate to cut costs during downturns, not just to expand capacity during booms.
The 2020-2025 acceleration reflects three specific catalysts. Post-COVID supply chain concerns drove manufacturing onshoring to the United States and Europe, requiring new factory investment. Artificial intelligence compute demands massive electrical infrastructure buildouts—ABB’s core competency. Electric vehicle charging networks became national infrastructure priorities across developed economies.
Trading at 32.2x price-to-earnings, ABB is priced for continued execution. Expected earnings growth of 8.4% doesn’t fully justify this multiple in my view, but the secular themes remain intact. For growth-oriented portfolios, I’d suggest waiting for a 10-15% pullback to around 28x earnings before accumulating aggressively.
The Dividend Aristocrats: Zurich Insurance and Geberit
Zurich Insurance: The Defensive Compounder
10-Year Performance: 64.7% total return (5.1% CAGR)
Current Yield: 4.4% (highest among top-tier selections)
Zurich represents predictable, boring wealth accumulation. The company grew dividends at 5.1% annually for ten years—perfectly aligned with stock price appreciation. This tells you earnings growth has been modest but stable.
Dividend progression: CHF 17.00 (2016) → CHF 28.00 (2024) → CHF 30.24 (2025)
Payout ratios of 75-85% provide sustainable growth while retaining enough earnings for capital buffers. The company maintains strong solvency ratios (215% vs. 150% minimum requirement) and has executed disciplined underwriting through multiple insurance cycles.
Despite a slight decline year-to-date in 2025, Zurich offers 9-10% total return potential combining 4.4% dividend yield with 5% annual dividend growth. The current underwriting environment favors property and casualty insurers—pricing remains strong after 2020 catastrophe losses, and higher interest rates boost investment income.
Think of Zurich as a bond yielding 5% with built-in inflation protection through dividend growth. This is a core holding for conservative portfolios, not a tactical trade.
Geberit: Quality Manufacturing Excellence
10-Year Performance: 76.5% total return (5.9% CAGR)
Return on Invested Capital: 23% (five-year average)
Geberit exemplifies disciplined capital allocation in a mature industrial business. The company maintains global leadership in concealed cisterns and bathroom systems—products with recurring revenue characteristics and pricing power despite construction cyclicality.
The dividend history shows remarkable consistency:
- 2016: CHF 8.40
- 2017: CHF 10.00 (special one-time increase)
- 2018-2025: Annual increases of 0.8-3.75% reaching CHF 12.80
Geberit returns 88% of free cash flow to shareholders (70.6% dividends plus buybacks) while maintaining conservative leverage (net debt-to-EBITDA around 0.5x). This enables sustainable dividend growth even during cyclical downturns.
Trading at 33.9x price-to-earnings looks expensive until you consider the 23% return on invested capital. Few industrial manufacturers achieve these economics. The premium valuation reflects quality and defensive market positioning—renovation cycles matter more than new construction for Geberit’s business model.
The Pharmaceutical Recovery Story: Roche and Novartis
Understanding What Happened (And Where Opportunity May Exist)
Both Roche and Novartis underperformed the broader market over ten years—2.94% and 3.96% annual returns respectively. This reflects real challenges: patent expirations, R&D setbacks, and COVID-19 diagnostic normalization for Roche.
However, both companies delivered 25%+ returns during 2024-2025, completing a recovery from 2022-2023 weakness.
Roche (ROG):
- Current price: CHF 348.90 (up from CHF 260.70 in 2016)
- P/E ratio: 27.7x (expected to compress to 15.64x by 2026 if earnings recover)
- Analyst consensus target: CHF 326.4 (range: CHF 232-CHF 448)
- Dividend yield: 2.8%
Roche’s valuation assumes significant 2026 earnings recovery—the expected P/E compression from 27.7x to 15.64x requires roughly 77% earnings growth. That’s a big assumption requiring no major patent expirations, stable diagnostics revenue, and pipeline success.
The analyst target of CHF 326.4 implies modest downside from current levels. But here’s the interesting part: Roche ranks second globally for pharmaceutical R&D readiness according to IMD’s 2025 rankings. Their dual business model—oncology pharmaceuticals plus diagnostics—provides diversification that most pharma companies lack.
For patient investors who believe Roche’s pipeline will deliver, current valuations offer a recovery play. The 2024-2025 gains priced in optimism; now management must execute. I’d suggest waiting for valuations below 25x earnings (around CHF 310-320) before considering positions, but the long-term opportunity deserves attention.
Novartis (NOVN):
- Current price: CHF 92.85 (up from CHF 63.29 in 2016)
- P/E ratio: 16.9x (attractive versus sector median of 18-20x)
- Dividend yield: 3.77%
- Expected earnings growth: 5.5%
Novartis completed its transformation to a pure-play pharmaceutical company in 2022 after spinning off Alcon. The company now focuses entirely on medicines, reaching 300 million patients globally with innovative therapies.
The 2024 fiscal year showed double-digit net sales and profit growth—the first full year demonstrating the strategic clarity this transformation provided. Trading at 16.9x earnings with 3.77% dividend yield and 28 consecutive years of dividend increases, Novartis offers value relative to Roche.
The company ranks fourth globally for pharmaceutical R&D readiness and maintains strong patent protection in key franchises including Cosentyx, Entresto, and emerging pipeline assets. Expected 5.5% organic sales growth with improving margins supports 6-8% total returns combining dividends and modest capital appreciation.
Both pharmaceutical companies deserve consideration as potential recovery opportunities rather than value traps. Patent challenges are real, but so are the R&D capabilities and global market positions. The key is entering at valuations that properly account for risk.
The Cyclical Value Plays: Holcim and Nestlé
Holcim: Construction Materials at the Bottom
10-Year Return: 76.0% (5.8% CAGR) | Year-to-date 2025: -12.6%
Holcim fell sharply in 2025 on fears about construction spending weakness. Yet the company just reported record 2024 results: 19.1% EBIT margin, CHF 3.8 billion free cash flow, and 11.2% return on invested capital.
The market’s 12.6% selloff ignores these operational achievements. Despite volume pressures, Holcim achieved record margins through pricing discipline and cost control. Their CHF 3.8 billion annual free cash flow supports 4.5-5.5% dividend yields at current prices.
Cyclical troughs create opportunities. If construction spending simply stabilizes (not even recovers), Holcim can deliver 8-12% returns through:
- 3.9% current dividend yield
- 4-6% earnings growth from margin expansion
- 10-20% valuation multiple re-rating from current cyclical discount
Trading at 8-9x EV/EBITDA versus 10-12x historical average, Holcim offers asymmetric risk-reward for patient capital with 3-5 year time horizons. Analyst consensus targets CHF 79.21 (roughly 20-30% upside from current levels).
This isn’t a “safe” holding, but it represents excellent risk-reward for investors comfortable with cyclical volatility.
Nestlé: Evaluating the Turnaround Potential
10-Year Return: 28.8% (2.58% CAGR) | Year-to-date 2025: -7.4%
Nestlé delivered the weakest ten-year performance among our selections. The 2.58% annual return underperformed the SMI by over 5 percentage points. Dividend growth of just 0.6% annually essentially matched inflation at best.
The company faced structural headwinds: emerging market growth deceleration, health trends against processed foods, pricing power erosion, and poor management execution. The 2024 CEO change initiated a turnaround narrative focused on cost reduction and portfolio optimization.
Current valuation: 20.3x price-to-earnings (10-15% discount to historical norms)
Dividend yield: 4.2%
The 4.2% yield looks attractive on the surface. But zero dividend growth means your real purchasing power declines 2-3% annually with inflation. That’s the definition of a potential value trap—high yield masking business deterioration.
However, at current valuations, Nestlé might offer modest 7-8% returns if the turnaround materializes. Entry points below CHF 70 (currently CHF 72.68) would improve the risk-reward profile. The key question: can new management reverse structural market share losses and reignite organic growth?
For income-focused investors, I’d suggest better opportunities exist in Zurich Insurance (4.4% yield with 5% growth) or Swiss Life (4.23% yield with 15% growth). Both offer income plus purchasing power protection.
Building a Portfolio for 2026-2030: The Barbell Strategy
After analyzing ten years of performance data across Swiss blue-chips, successful wealth preservation requires asymmetry.
Most investors overweight pharmaceutical companies and consumer staples because they “feel safe.” Then they underperform the index for a decade. The winning approach combines defensive compounders with tactical growth and value opportunities.
Core Holdings (60% allocation): Dividend Compounders
Swiss Life (40% of core = 24% total portfolio weight)
Dividend compounding machine with 16.4% historical returns and 15.1% dividend growth. Expected 2026-2030 returns: 10-15% annually. Risk profile: low-moderate (insurance cycle volatility manageable). This forms the foundation—capital appreciation plus growing income.
Zurich Insurance (20% of core = 12% total portfolio weight)
Defensive insurance compounder delivering 4.4% yield plus 5% dividend growth equals 9-10% total return potential. Expected returns: 8-10% annually. Risk profile: low (bond-like volatility with equity upside). Provides portfolio ballast during market stress.
Tactical Satellites (40% allocation): Growth and Value Optionality
ABB (15% total portfolio weight)
Secular automation and electrification themes with 12.2% historical returns. Expected returns: 8-12% annually. Risk: moderate (premium valuation requires continued execution). Provides growth exposure to industrial technology trends.
Geberit (10% total portfolio weight)
Quality industrial compounder with 23% return on invested capital and consistent dividend growth. Expected returns: 6-9% annually. Risk: low-moderate (recession-resistant renovation cycles). Adds quality manufacturing exposure.
Holcim (10% total portfolio weight)
Cyclical value at trough pricing with 3.9% yield plus recovery optionality. Expected returns: 8-15% annually (wide range depending on cycle timing). Risk: high (requires construction market stabilization). Opportunistic value position.
Cash or Opportunistic Positions (5% total portfolio weight)
Reserved for deploying into Roche or Novartis if price-to-earnings ratios compress below 20x, or adding to Partners Group if further 15-20% decline occurs. Maintains flexibility for tactical opportunities.
Expected Portfolio Characteristics
- Blended dividend yield: 3.8-4.2%
- Dividend growth rate: 7-9% annually
- Total return target: 8-12% CAGR
- Maximum expected drawdown: 15-20% (versus 25-30% for SMI)
- Tax efficiency: High (particularly beneficial for Swiss residents)
This barbell structure provides 60% defensive ballast generating 4-5% yield with built-in dividend growth, and 40% tactical upside from automation, cyclical recovery, and quality industrial compounders.
The goal isn’t maximizing returns—it’s compounding capital at 8-12% annually with minimal permanent capital impairment. That approach preserves wealth across generations while still capturing upside from carefully selected growth opportunities.
Three Observations From Working With Swiss Clients
After years advising high-net-worth individuals and family offices across Switzerland and Europe, several patterns emerge from successful long-term investors.
Fiscal Discipline Compounds Across Generations
The Swiss Debt Brake isn’t a temporary policy experiment—it reflects a 200-year philosophy. When governments run surpluses and currencies appreciate, corporate capital allocation improves. Swiss companies don’t waste capital on empire-building because they operate in an environment where shareholders demand efficiency.
Compare Swiss Life’s 15.1% dividend growth with 84% sustainable payout ratio to Credit Suisse’s collapse in 2023. Credit Suisse violated Swiss prudence and paid the ultimate price. The contrast reveals how cultural and regulatory frameworks influence corporate behavior.
“Safe” Blue-Chips Can Underperform for Decades
Nestlé and Roche wore “defensive growth” labels for decades. Both delivered sub-3% annual returns over ten years. Strong brand recognition doesn’t guarantee returns—business model evolution and capital allocation discipline matter more.
The lesson: dividend yield alone means nothing. Demand dividend growth or accept inflation eroding your purchasing power. Swiss Life’s 15.1% dividend growth versus Nestlé’s 0.6% tells you everything about which business models create real wealth.
Volatility Doesn’t Equal Risk When You Have Time
Partners Group fell 46% in 2022. Holcim declined 12.6% in 2025. Both represent opportunities, not dangers, for patient capital with proper position sizing.
The real risk is buying “stable” Nestlé at 20x earnings and watching it compound at 2.58% annually for a decade while inflation erodes purchasing power.
Short-term price volatility in quality businesses with strong fundamentals creates opportunities. Permanent capital impairment from overpaying for deteriorating business models represents true risk.
Why Switzerland Continues Winning
The Swiss model succeeds because it rejects short-term thinking at every level. Fiscal policy through the Debt Brake forces discipline. Corporate governance structures favor shareholders over management. Currency stability protects purchasing power. Banking regulations prevent excessive risk-taking.
These aren’t accidents—they’re intentional choices embedded in legal and cultural frameworks developed over centuries.
The result? A decade where Swiss Life compounded at 16.4% annually, Zurich delivered 4.4% yields with 5% growth, and even “boring” Geberit achieved 23% return on invested capital.
Heading into 2026, the same structural advantages remain:
- Swiss government debt: 27.8% of GDP (Eurozone: 88.6%)
- Swiss National Bank policy: stable, predictable, boring
- Corporate governance: consistently shareholder-friendly
- Currency appreciation: ongoing structural tailwind
The question isn’t whether Swiss equities will continue performing well. The question is whether investors have the discipline to ignore short-term noise and compound capital steadily for the next decade.
Key Takeaways for 2026
Strong Core Holdings:
- Swiss Life (SLHN): 16.4% historical CAGR, 15.1% dividend growth, 4.23% yield
- Zurich Insurance (ZURN): 4.4% yield with 5.1% dividend growth, defensive characteristics
- ABB (ABBN): 12.2% historical CAGR, automation and electrification exposure
- Geberit (GEBN): 23% ROIC, consistent dividend growth, quality compounder
Opportunistic Positions:
- Holcim (HOLN): Cyclical value at trough, 3.9% yield, 20-30% recovery potential
- Roche (ROG) and Novartis (NOVN): Pharmaceutical recovery opportunities at appropriate valuations
Approach With Caution:
- Nestlé (NESN): Value trap characteristics with 0.6% dividend growth
- Partners Group (PGHN): High volatility cyclical exposure requiring careful timing
Portfolio Construction:
- Core: 60% allocation to Swiss Life and Zurich Insurance (defensive dividend compounders)
- Satellites: 40% allocation to ABB, Geberit, Holcim, and opportunistic positions
- Expected returns: 8-12% annually with 15-20% maximum drawdown
- Suitable for: Long-term wealth preservation with moderate risk tolerance
The Swiss market offers compelling opportunities for disciplined investors focused on sustainable wealth creation rather than speculation. Success requires patience, valuation discipline, and understanding which business models create lasting value.