I’ve spent nearly two decades navigating financial markets from the Swiss perspective—watching currencies shift, observing central banks recalibrate their reserves, and understanding how real money actually moves when confidence fractures. What I witnessed in late January 2026 wasn’t a typical market correction. It was a collision between structural reality and leveraged excess, and it’s revealing something crucial about where gold is headed.
Let me tell you the story of what happened, why it matters, and where this all leads over the next decade.
The Rally That Defied Every Skeptic
The gold story of 2024-2025 was nothing short of extraordinary. When I began tracking the market at the start of 2025, gold was trading around $2,063 per ounce. By January 28, 2026—just thirteen months later—it had rocketed to $5,594.82. That’s a 171% climb. Anyone who lived through this period remembers the headlines, the FOMO, the late-night conversations about whether gold could reach $6,000, then $7,000.
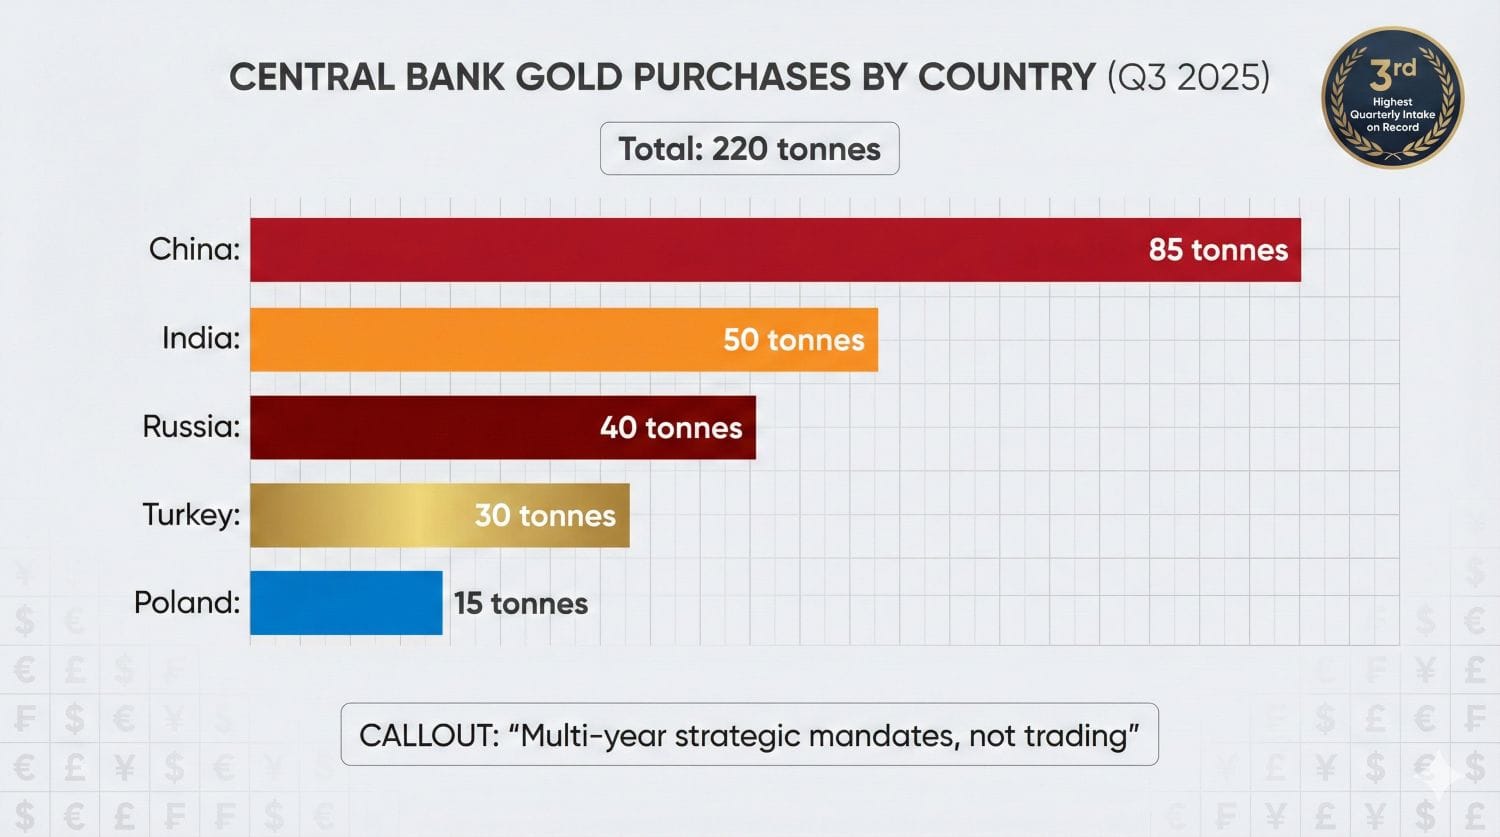
The remarkable part? This wasn’t irrational speculation. Behind every dollar of that $3,500 move sat legitimate structural demand. I watched central banks—China, India, Russia, Turkey, Poland—systematically accumulate gold at levels I’d never seen in my career. In Q3 2025 alone, central bank purchases hit 220 tonnes, the third-highest quarterly intake on record. This wasn’t trading. This was reserve strategy. These were monetary authorities making multi-decade allocation decisions, and they were all pointing in the same direction: away from dollar dominance.
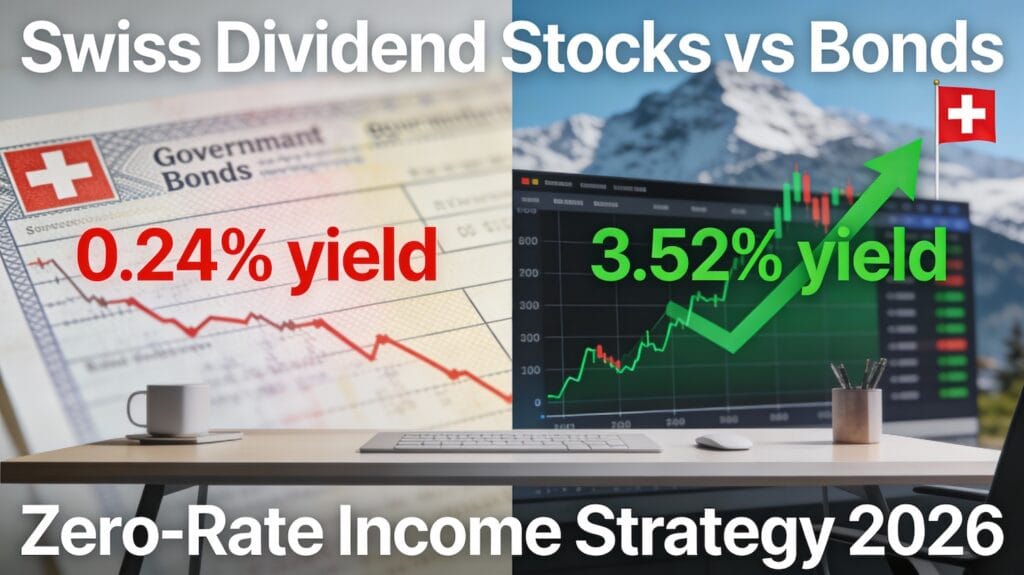
Simultaneously, the narrative was compelling. The U.S. fiscal deficit was exploding. Geopolitical fragmentation was accelerating. Emerging markets were actively working to reduce dollar dependence. And for the first time in four years, gold ETFs returned to buying mode, attracting $85 billion in net inflows through 2025 alone. Even conservative institutional investors were acknowledging what gold advocates had been saying for years: in an era of monetary fragmentation and currency debasement, physical gold wasn’t speculation—it was insurance.
I believed in the story. Most serious investors did. The convergence of structural demand from central banks, hedging demand from institutions, and retail participation suggested something genuine had shifted. This wasn’t hype. This was a fundamental reallocation of global capital occurring in real time.
Then came Friday, January 31, 2026.
The Day the Leverage Unwound
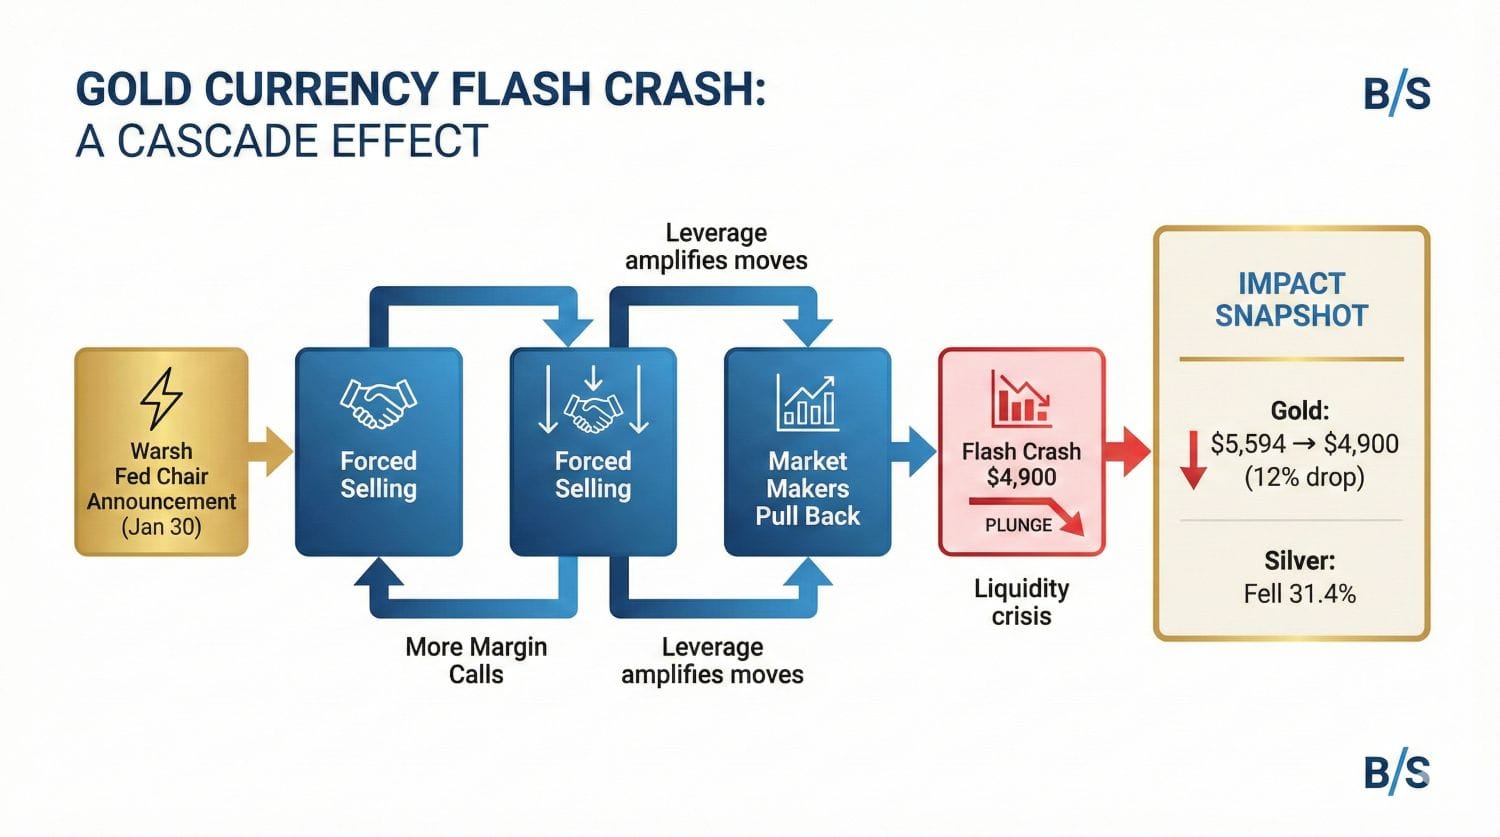
The immediate trigger was straightforward: President Trump announced that Kevin Warsh, a known inflation hawk and former Federal Reserve governor, would be the next Fed Chair. The market had been pricing in a different scenario—a more dovish Fed chair who would aggressively cut rates and weaken the dollar. Warsh’s appointment reversed that narrative in hours.
But here’s where the story gets instructive: the magnitude of the crash—12% in a single day—wasn’t proportional to the news. The Warsh appointment was meaningful, but it shouldn’t have triggered a rout of that magnitude. What actually happened was something far more mechanical and far more dangerous: leverage unwind meeting a liquidity crisis.
I’ve advised enough traders to know what happens when overleveraged positions face margin calls. Many gold investors had borrowed heavily to amplify their positions—often 2 or 3 times their actual capital. When prices started falling on the Warsh news, brokers immediately demanded additional collateral. The problem: Friday was the last trading day of January, and February 1st is Saturday. That meant traders facing margin calls had essentially one day—not a normal Monday morning—to raise cash and prevent liquidation.
What followed was a cascade. Desperate selling forced prices lower. Lower prices triggered more margin calls. More margin calls forced more selling. Market makers, seeing volatility explode and unable to manage risk, pulled back from providing liquidity. With fewer buyers at any price level, gold had to crash further to attract even panicked sellers willing to accept any price.
Silver, which typically experiences more leverage and more violent swings, crashed even harder—31.4% in the same session. This is what flash crashes look like—not fundamental collapses, but mechanical implosions born from overleveraged positioning meeting an unexpected shock in a structurally compressed window.
Why the Crash Doesn’t Tell the Real Story
The moment I observed the crash, I asked myself a critical question: had anything actually shifted in the macro environment? Had central banks stopped buying gold? No. China extended its buying streak to 14 consecutive months through December 2025, demonstrating unwavering commitment to reserve diversification. Turkey, India, Russia—all continued accumulating aggressively. These aren’t leveraged traders spooked by Warsh’s appointment. They’re monetary authorities with multi-year strategic mandates, operating on timelines measured in decades, not days.
Had geopolitical risks eased? No. Iran remained hostile. U.S.-Europe trade disputes over tariffs and territorial ambitions persisted. North Korea’s nuclear posture stayed confrontational. Meanwhile, the de-dollarization momentum accelerated rather than retreated. If anything, the fragmentation that drove gold’s entire rally remained more intact than ever.
Had the U.S. fiscal situation improved? Absolutely not. The government spends far more than it collects, and that structural problem has only accelerated. De-dollarization pressures from Russia, China, and emerging-market allies seeking alternatives to the dollar-dominated financial system remained as potent as ever.
From a technical standpoint, gold was already recovering. Within 24 hours of the crash, it bounced nearly $200. By early February, it had recovered to $4,930—already erasing much of the damage. Historically, panic-driven crashes in gold recover within 2-3 months as initial fear dissipates and experienced buyers recognize that panic sellers have left genuine opportunities on the table.
The narrative became clear: the crash was a buying opportunity, not a warning signal. And here’s what matters most—the fundamentals that drove gold to $5,500 hadn’t changed. At all.
Where Gold Goes in 2026
The consensus among major global banks is remarkably cohesive on this point. JP Morgan projects gold averaging $5,055 in Q4 2026, supported by robust central bank demand averaging 566 tonnes per quarter. Goldman Sachs expects $4,900 by year-end. Deutsche Bank forecasts nearly $5,000. HSBC, historically bullish on precious metals, projects $5,000 in the first half of 2026. Even the more conservative Wells Fargo and Morgan Stanley clustered their estimates between $4,500-$4,900.
The realistic scenario playing out now: recovery to around $5,500 by summer 2026 as the initial panic fully clears, followed by consolidation around $4,800-$5,000 by December. That’s not a collapse. That’s actually recovery to levels that would have seemed wildly optimistic before the Warsh appointment.
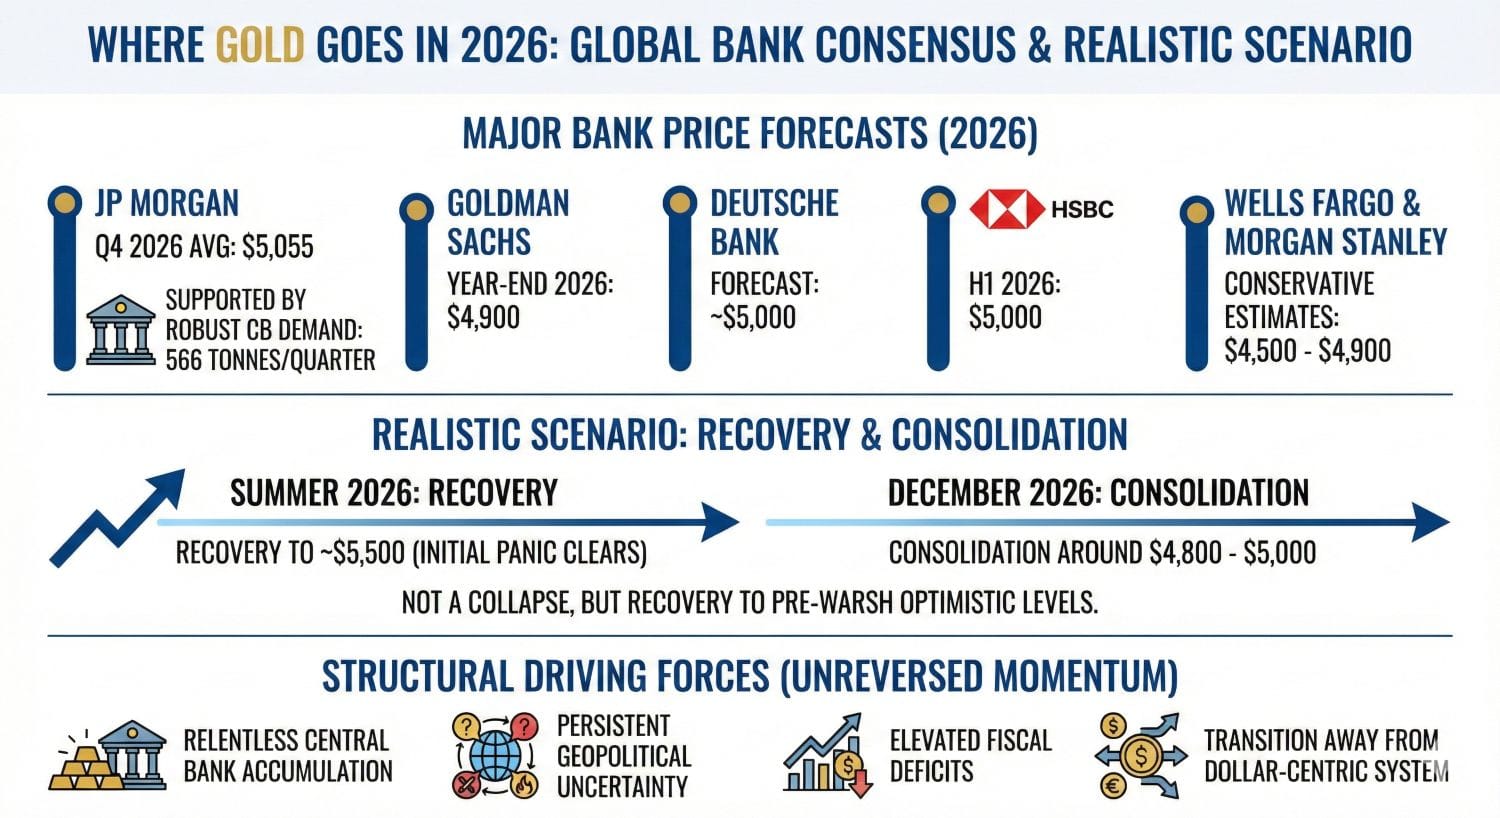
What’s driving this consensus? Precisely those structural forces I mentioned: relentless central bank accumulation, persistent geopolitical uncertainty, elevated fiscal deficits, and the ongoing transition away from dollar-centric reserve systems. These factors don’t reverse because of a single Fed Chair announcement. The momentum is too powerful, the underlying rationale too sound.
The Five-Year Picture: 2031 and Beyond
When I zoom out to a five-year horizon, the bull case becomes genuinely compelling. Between now and 2031, I expect these dynamics to intensify rather than fade. Central banks will likely continue accumulating at 1,000+ tonnes annually, representing roughly $60 billion in incremental annual demand. Tariffs and deglobalization will likely keep inflation elevated above historical averages, supporting gold’s role as an inflation hedge. Mining supply will remain constrained—major projects take a decade from discovery to production, and there’s limited room for rapid expansion.
Meanwhile, the structural return to ETF inflows in 2025 suggests a deeper shift in institutional positioning. After four years of redemptions, the fact that 2025 saw record inflows signals that sophisticated investors are fundamentally reassessing gold’s role in portfolios. That trend is likely to persist and accelerate through 2026 and beyond.
By 2031, analyst forecasts cluster around $5,400-$6,000, with the most bullish projections reaching $10,000+. That represents roughly 10-22% cumulative appreciation from current levels, or about 2% annualized. For an asset that produces no yield, this appreciation is driven entirely by reserve accumulation, inflation hedging, and currency depreciation dynamics. That’s a powerful and durable thesis.
The Decade Ahead: 2036 and the Structural Shift
Moving out ten years introduces legitimate uncertainty—any decade-long forecast is partly philosophy—but the structural case remains powerful. By 2036, the U.S. fiscal situation will have either been addressed through painful adjustment or will have worsened. Neither scenario is gold-negative. De-dollarization trends will have either continued or faltered; again, the probabilities favor continuation. Geopolitical fragmentation is unlikely to reverse entirely.
Analyst forecasts for 2036 cluster around $5,200, with reasonable upside to $5,500. This reflects a belief that if structural trends hold—elevated deficits, geopolitical fragmentation, emerging-market reserve diversification—gold appreciates at modest but consistent rates over a decade.
What This Means for Your Strategy
Here’s what I tell clients: gold isn’t a trading vehicle. It’s a reserve asset. The January crash was violent and painful for anyone holding leveraged positions, but it was a technical event, not a fundamental one. The underlying demand drivers remain entirely intact.
If you held gold before the crash, the current pullback is likely a buying opportunity, not an exit signal. If you’re considering entering, $4,900 gold is considerably more attractive than $5,500 gold was. If you’re a trader, the volatility will persist through early 2026 as markets digest policy implications—but leverage is dangerous, and scaling in gradually beats trying to time perfection.
The bottom line: gold’s crash was dramatic but temporary. The forces that drove it from $2,063 to $5,594 remain structurally intact. Recovery to $4,800-$5,000 by year-end 2026 is the consensus. Five-year targets near $5,400-$6,000 are reasonable. And ten-year appreciation is likely, assuming geopolitical fragmentation and fiscal pressures persist—which they probably will.
The volatility we witnessed was the price of owning an asset that central banks will never abandon and that serves as society’s ultimate store of value when everything else fails. That’s not a bug. That’s a feature.
Ready to structure your precious metals allocation as part of a diversified, multi-currency strategy? The foundation of true wealth preservation in an era of monetary fragmentation is understanding where to hold assets and how to position across currencies and geographies. At Easy Global Banking, we help international clients open a foreign bank account that supports precious metals holdings, multi-currency exposure, and genuine diversification away from single-country risk. The question isn’t whether gold belongs in your portfolio—it’s how much, in what form, and held where. Let’s discuss your situation and build a strategy aligned with your goals.